Materials science laboratory · Completed
Diffusion measurement and curve fitting
A dye-diffusion experiment using time-series images, MATLAB curve fitting, Fick's second law, and Arrhenius analysis.
Boston University · ME306 · Team laboratory project · Fall 2025
On this page
- Role
- Team laboratory contributor
- Contribution
- Experiment, image-based analysis, MATLAB fitting, and report preparation with classmates.
- Evidence
- Arrhenius fit: 23.6 kJ/mol for sample A; sample B remained inconclusive
Experiment
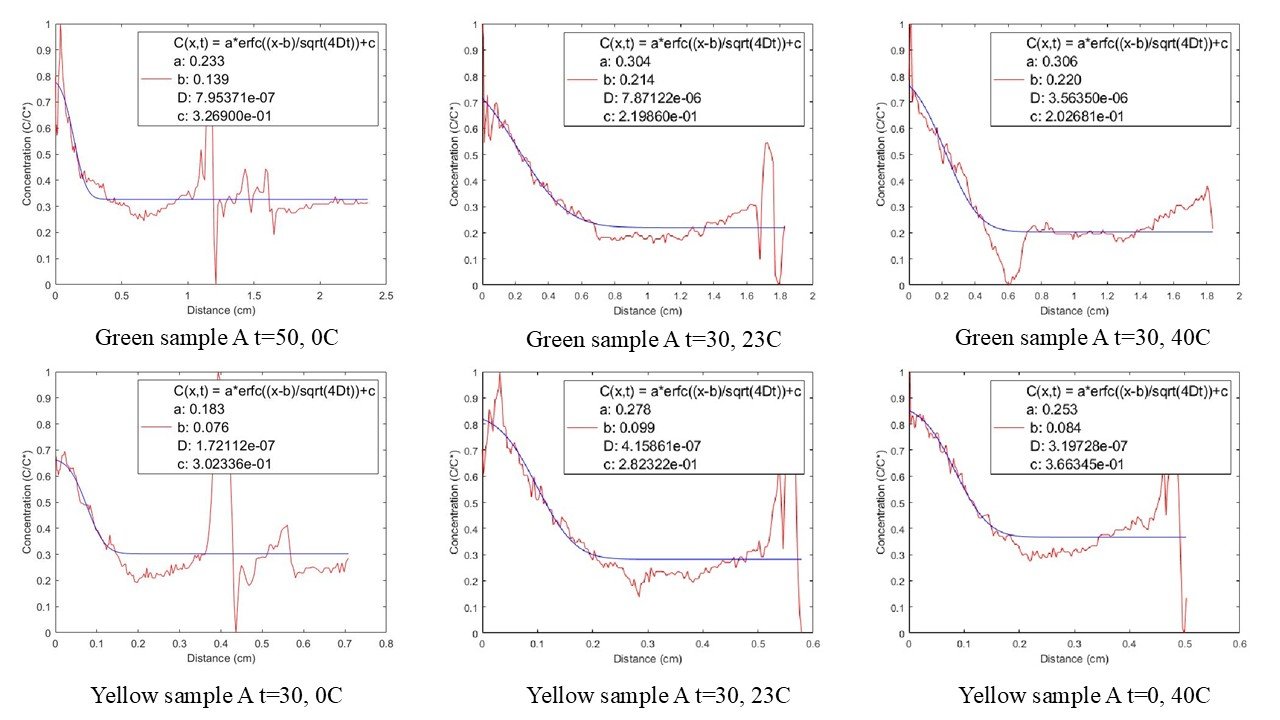
Our group tracked green and yellow dye diffusing through two solutions at 0°C, 23°C, and 40°C. We photographed the cuvettes at ten-minute intervals, converted vertical pixel intensity into concentration profiles, and excluded cases where dye reached the bottom and violated the semi-infinite boundary assumption.
We held the cuvettes in their temperature baths for 20 minutes before adding dye, then removed them briefly against a white background for each photograph. Using two dye colors at each temperature gave us paired measurements, but it also exposed color-dependent image noise and wicking that a single trace would have hidden.

Analysis
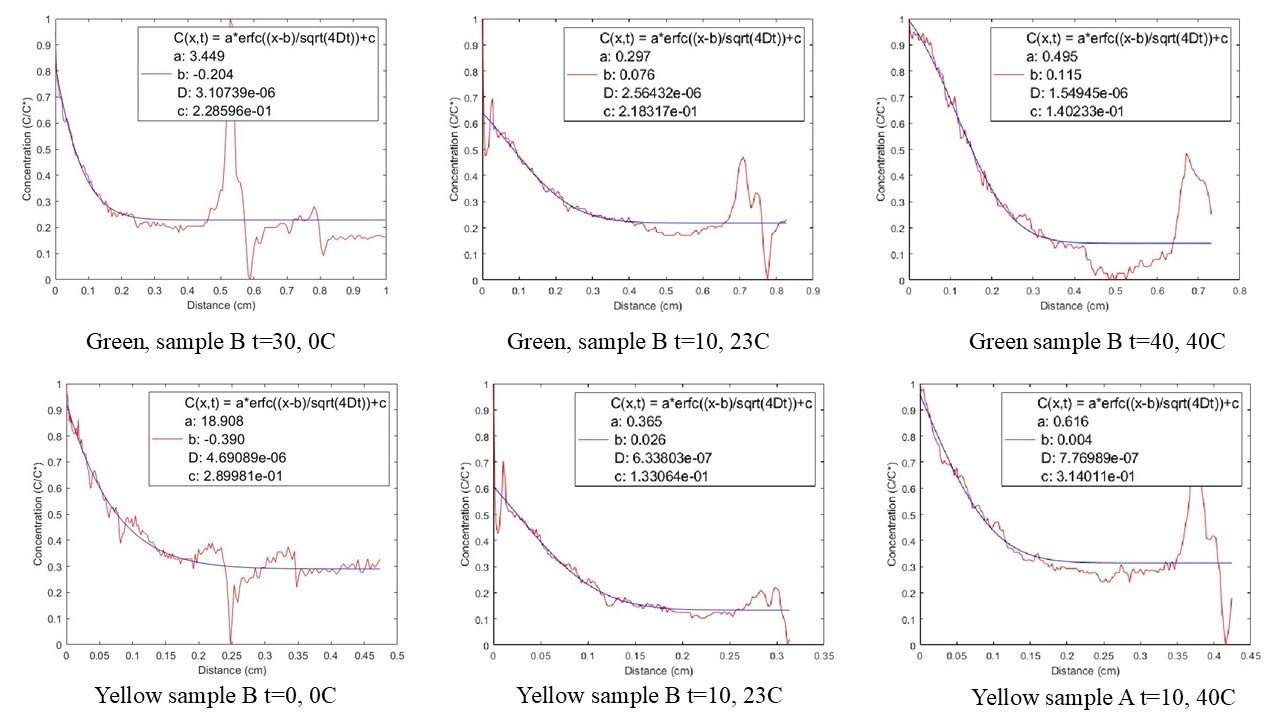
We fit each concentration profile to the error-function solution of Fick’s second law. The fitted diffusion coefficients then supplied an Arrhenius plot of ln(D) against 1/T.
For each image, the script sampled pixel intensity along the cuvette height and normalized it into a concentration profile. MATLAB then varied the diffusion coefficient until the error-function curve minimized the squared residuals against the image-derived data. Profiles were removed when bubbles, dye wicking, or contact with the bottom made the one-dimensional semi-infinite model a poor description of the photograph.
For sample A, the fit to the temperature averages produced an activation energy of 23.6 kJ/mol. Sample B produced a nearly flat Arrhenius trend, corresponding to about 1.5 kJ/mol in one fit and approximately zero in the averaged fit. Dye-to-dye variation, wicking, image noise, and bubbles made that result too uncertain to treat as a reliable material property.
Reading the result
Sample A produced the clearer temperature response, but even those runs did not increase monotonically for every dye. The green and yellow traces differed enough to create wide error bars in the Arrhenius fit. Sample B’s near-horizontal fit was more likely a consequence of the experiment and the image-processing assumptions than a defensible zero activation energy.
The Arrhenius slope was sensitive to the small number of noisy diffusion coefficients. More controlled dye placement, fixed camera geometry, better temperature control during imaging, and more replicates would reduce that sensitivity.
Diffraction measurement
An earlier individual ME306 exercise used laser diffraction to estimate a grating’s lattice spacing and symmetry. I calculated a lattice spacing of approximately 85.7 nm and identified square symmetry from the pattern. I include it here as supporting materials-science work rather than a separate project.
I used first-order diffraction peaks and a linear fit of the indexed spot distance against the sine of the diffraction angle. The equal horizontal and vertical spacing supported the square-symmetry identification; tilting the grating split the fitted slopes along the two observed directions.
My contribution
The diffusion study was a group project. I participated in the experiment, analysis, and report preparation, but the surviving report does not assign individual ownership of each data set or calculation. The experimental procedure and diffusion results above are therefore stated as team outcomes.